Saturday, January 30, 2010
Dow - 'Worst is over' or 'Double-dip '
Basically there are two schools of thought amongst the Wall Street Gurus on US economy. The optimists believe that the worst is over and the pessimists are looking for a double-dip W-shaped recovery.
Similarly Dow is at a crossroad at the moment. If it can hold above the lower support line at around 10,000 level and can start to turn upwards, then it is going for its wave (V), heading for 11,000 and above .
However, if Dow drops below the lower trend line, chances are it is heading for its 2009 low of 6,547
The technical indicators have shown clearly that Dow's current correction is, at best, of the magnitude of that in June 2009 of about 7.4%.
The moment the technical indicators start to develop multiple lows with Dow unable to break its January high in the next technical indicator's peak then a major A-B-C formation will be the only outcome.
Friday, January 29, 2010
Let's listen to the Gurus
Nouriel Roubini: Stock market rallies are likely to fizzle out during second half of of the year
Two days ago Marc Faber said,"the market has become overbought, the S&P 500 may retreat 20% from its 15 month height". In early January, he advised prudent investors to buy gold at its current price of about US$ 1,100.00
Earlier this week Robert Prechter of Elliott Wave International told CNBC that this is perhaps the last chance to get out of stocks. He believes that stocks will fall below the March 2009 lows. Prechter believes if deflation comes, gold could see a 40% drop from its peak.
George Soros : Gold is in the midst of the ultimate bubble. "When interest rates are low we have conditions for asset bubbles to develop", "The ultimate asset bubble is Gold"
Thursday, January 28, 2010
Dr. Mohamad Asri Zainul Abidin
Dr. Mohd Asri , who was Perlis mufti for two years before quitting the position to move to Wales last December to research on Islam. He has said a few things on Islam and Malays:
"The idea of being Malay and Muslim should be decoupled"
"Islam was not given just to the Malays"
"Do not in your efforts to defend Malay right relate it to Islam"
"Islam was not sent down by God to protect Malays, but all of humanity"
"You cannot say Islam does not defend you because you are Chinese or Indian"
Wednesday, January 27, 2010
Where is Malaysia heading?
The main question is who could have done this? What is the motive? Who will benefit from these events? What else is going to happen? With all these nonsenses going on, it is advisable not to put too much money in Malaysian stocks. It is better to put some of the money in Singapore and Hong Kong markets. But not at this moment, has to see whether Dow will stop at 10,000 level and Hang Seng at 18,000 level to form the major wave (IV), the entry point.
Tuesday, January 26, 2010
Bursa Malaysia
The previous wave count for KLCI of wave 6 and 7 that followed wave 5 of (III) is no longer correct, they are wave A and B of (IV). Industrial Index as shown below has a clearer wave A-B of major wave (IV). Similar to Dow and Hang Seng, The Industrial Index can either heading for major wave (IV) as show.
Or, it is heading for the big C as shown below. It all depends on whether Dow will continue with its bull run that started in March 2009 by holding above 10,000 and forms its major wave (IV) Or Dow has completed its major wave B and is at the beginning of its major wave C towards 6,000. Under such circumstances, Industrial Index will move south in a similar way as shown below.
The market movement in the next 5 to 10 days is rather crucial, hopefully it can indicate whether the bull run since March 2009 remains intact and that the market is at the tail-end of major wave (IV) before the starting of the major uptrend wave (V) Or the Market is at the beginning of the big C that can retest the March 2009's low.
Monday, January 25, 2010
Dow, Hang Seng and STI
At this moment the lower resistance line is very crucial. As long as Dow can remain above this supporting line, most investors will not rush to sell stocks, there may be some that choose to reduce their exposure in stocks in stages. Must monitor closely the 10,000 level for Dow.
Hang Seng Index of Hong Kong is in a same situation as Dow. As long as Hang Seng remains within the up-trend channel and does not go below 18,000 it can form a major wave (IV). But the moment Dow falls below 10,000 Hang Seng will definitely break below its 18,000 level and the world economy will be heading for its second dip.
Singapore STI's wave form looks rather different, it is at its wave 5 of major Wave (I). If Dow and Hang Seng go for wave (IV) and (V), STI is likely to proceed with its wave 6, 7, 8 and 9. But if Dow and Hang Seng are heading for the big C, STI will likely to go for a 100% retracement for its wave (II) and to form a double bottoms reversal formation.
Sunday, January 24, 2010
Bull Run Remains Intact OR Dow Heading For 6000
Dow dropped 2% on Friday to close at 10172, that is 113 points (1%) below wave 6 (at 10285). My previous assumption that Dow would be heading for wave 7,8 and 9 is obviously wrong. One thing is for sure, major wave (III) has ended.
With the latest development, Dow is EITHER heading for a more Optimistic Scenario as shown below. Wave (I), (II), (III), (IV) and (V) formation with 10,000 level as the support for wave (IV).
OR Dow is heading for a more Pessimistic Scenario of Robert Preachter's big A-B-C possibility as shown below.
If Dow ultimately goes for the pessimistic option, 2010 will remain in record as another disastrous Tiger year.
Friday, January 22, 2010
Dow Continues to fall at the opening bell
Dow dropped almost 60 points at the opening, after 30 minutes of trading, the drop has narrowed to about 30 points. As long as Dow does not fall below wave 6 (10,200), wave 8 remains intact. Since the drop is sharp, wave 8 may be completed within a shorter period, much less than the 10 days that I have mentioned previously. After the corrective wave 8, there will be another uptrend wave 9.
However, if Dow goes below 10,200 then it may be better to stay away from the market for a while as Dow may be heading for one of the following possibilities.
Thursday, January 21, 2010
Dow fell 138 points after 90 minutes of Trade
Dow has given up 138 points (1.3%) after 90 minutes of trading on Thursday Morning (New York).
No good, no good, it shows that my previous wave count for Dow is not right. If my previous wave count is correct, today's drop should not go below yesterday's low as shown above
That small red doji wave next to 4 that I have neglected is possibly the sub-wave ii of wave 5 as shown above. After this adjustment, I managed to add one more sub-wave to wave 7, with this wave 7 has its five sub-waves i, ii, iii, iv and v completed. The down candlestick on Tuesday marked the beginning of corrective wave 8. If this is true, Dow won't be good at least for the next 10 days. This wave 8, in theory, it should not go below wave 6 at around 10200. That should be the last line of defense. The first line of defense is top of wave 5 at 10347.
Oh my God !!!
Who could have done these ? Take a guess. This is really a dangerous country, anything can happen and nobody know whether the truth reported is the real truth. I hope this is not a political game.
Wednesday, January 20, 2010
Dow gave up 162 points within 1 hour
Dow gained 116 points at the close of Tuesday trading but fell sharply at the open on Wednesday, it gave up 162 points (1.5%) after one hour of trading due to poor earning reports by the banking sector and the bank lending restrictions imposed by the Chinese Government.
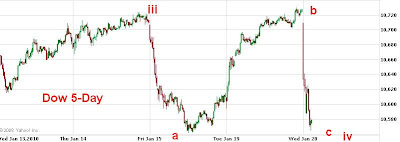
If Dow can hold about this level, it is forming a small a-b-c wave iv as shown in the 5-day chart above. Has to wait until the closing to reassess the likely wave form.
Tuesday, January 19, 2010
Dow gained about 40 points after 30 minutes of trading
Dow put on about 40 points after half an hour of trading. It is likely that its sub-wave v of wave 7 has started. Sub-wave v is likely to last for a week to complete the wave 7 if there is no extension. Corrective wave 8 can last for about two to three weeks before the starting of the up-trend wave 9.
Some of the stocks in Bursa Malaysia may be ready to move, especially those that have consolidated for several months and have completed its major waves (I) & (II) and have also completed their waves 1 & 2 or sub-waves i & ii as shown below.
Monday, January 18, 2010
Shanghai SSEC and Hong Kong Hang Seng Index
One of my friend that used to trade in Hong Kong Stock Market called up and asking for my reading on Hang Seng Index. I think, most likely, he is not so comfortable about the Hong Kong Market at this moment. Before looking at the Hang Seng Index, it may be good to have a look at the Shanghai market SSEC Index.
Shanghai SSEC has completed its major wave (I) in August 2009. From its low of 1706 in November 2008 to its height of 3471 in August 2009, SSEC has gained 103%. The market has been consolidating for almost 5 months. So far SSEC has completed wave A and B of its major wave (II) and its downward wave C has just started, it is likely to drift downwards in the next one to two months.
My wave count for Hang Seng is as shown above. It has completed major waves (I), (II) and (III). It is likely to move side-way to form a complex wave (IV), since it has a simple wave (II). However, if the index starts to surge and move higher than its November 2009 height, then, Hang Seng is extending its wave (III) from 9 waves to 13 waves. But in view of the Shanghai Index being in consolidation phase, it is highly unlikely that it wave (III) will be extended.
Sunday, January 17, 2010
Dow - 100 points drop, biggest in 2010
Dow recorded its biggest drop in 2010 on its 10th trading day this year. Dow remains in its wave 7 as shown above.
Last Friday pullback can be the sub-wave iv of wave 7. However if Dow continues to go lower in the next few day and if it drops below 10428, the low of sub-wave ii, I will have to check my wave count properly for other possibility.
Saturday, January 16, 2010
Unisem, Kinsteel and YTLE
Unisem is in major wave (III) at the moment. Within its last 10 trading sessions, after its simultaneous price and OBV breakout, its price put on 60% from Rm 1.60 to Rm 2.60.
Its volume in the last 10 trading sessions were high especially last Friday, this can be the last surge for its major wave (III). Last Friday candlestick opened with a gap, is this the exhaust gap? Wait and see. Rm 1.80 can be the target for its major wave (III) if the magnitude for (III) is the same as (I)
The OBV for Kinsteel has set a new high and this was accompanied by a price broke-out. It was at the initial stage of its major wave (III) with a minimum target of Rm 1.50, assuming the magnitude of (III) will equal to that of (I)
YTLE is currently in its wave 5. Even though its current price is approaching its wave 3 height, but it volume has shrunk drastically and its OBV has started to show sign of distribution indicating possible final journey for its wave 5 of major wave (III) at this moment unless its trading volume can increase rapidly to match its wave 3 volume.
Friday, January 15, 2010
Thursday, January 14, 2010
RCE Capital Bhd
RCE Capital's OBV has set a new height at the close of yesterday trading session. It is currently forming its 7th wave. Sub-waves i and ii have been completed, sub-wave iii has just started. Wave 7 can be quite dynamic especially the sub-wave iii of wave 7.
Wednesday, January 13, 2010
Inch Kenneth, Scomi, MRCB, Duta Land
Inch Kenneth remains in wave 3, its OBV is particularly strong. At the same price level as January 2008 the OBV accumulated is 250 million shares which is close to 60% of its total number of shares. No sign of distribution so far.
Scomi Group's OBV has started to set new height whereas its stock price remained within the down trend channel, a very strong sign of accumulation. As volume precedes price, with the OBV breakout, the price will have to breakout and run. It has completed its major wave (II) A-B-C and the sub-wave i of its wave (III). At the begining of (III), this is an excellent stock with limited downside risk. Minimum target for wave (III) is RM 1.00. If wave (III) is the extended wave then the potential minimum target is Rm. 1.30. can easily double the money. Watch out when it breaks 50 sen level.
Somebody asked me to have a look at Scomi Marine. It has a rare expanding triangles. An initially strong OBV has turned into a normal OBV at the moment. Just compare its OBV with that of Scomi Group, one can readily see the difference. It has started its wave (III) with minimum target at 95 sen.
MRCB is an excellent stock on the run with both its OBV and price breakout. If magnitude of wave (III) is same as wave (I), Rm 2.20 is the target. If wave (III) is an extended wave then 2.75 becomes the target.
Duta Land shows strong OBV accumulation, its OBV and its price moved in opposite direction as shown. Its OBV is on the verge of breaking out possibly together with a price breakout from its downward channel. For those who have bought Duta Land in June and have been frustrated over this stock, I think good time is around the corner. Minimum target for wave (III) is 90 sen. Its Warrants at 20 sen is a good bet to get more than a double.
Things may look promising at the moment, but chart-form can change, OBV can change, always look out for the unexpected.
Scomi Group's OBV has started to set new height whereas its stock price remained within the down trend channel, a very strong sign of accumulation. As volume precedes price, with the OBV breakout, the price will have to breakout and run. It has completed its major wave (II) A-B-C and the sub-wave i of its wave (III). At the begining of (III), this is an excellent stock with limited downside risk. Minimum target for wave (III) is RM 1.00. If wave (III) is the extended wave then the potential minimum target is Rm. 1.30. can easily double the money. Watch out when it breaks 50 sen level.
Somebody asked me to have a look at Scomi Marine. It has a rare expanding triangles. An initially strong OBV has turned into a normal OBV at the moment. Just compare its OBV with that of Scomi Group, one can readily see the difference. It has started its wave (III) with minimum target at 95 sen.
MRCB is an excellent stock on the run with both its OBV and price breakout. If magnitude of wave (III) is same as wave (I), Rm 2.20 is the target. If wave (III) is an extended wave then 2.75 becomes the target.
Duta Land shows strong OBV accumulation, its OBV and its price moved in opposite direction as shown. Its OBV is on the verge of breaking out possibly together with a price breakout from its downward channel. For those who have bought Duta Land in June and have been frustrated over this stock, I think good time is around the corner. Minimum target for wave (III) is 90 sen. Its Warrants at 20 sen is a good bet to get more than a double.
Things may look promising at the moment, but chart-form can change, OBV can change, always look out for the unexpected.
Subscribe to:
Posts (Atom)