All the three indices gained more than 1% at the opening of Wednesday trading session. This rebound can be the mini wave (ii) rebound for sub-wave v as shown below. I am expecting the sub-wave v to end near the 10,000 to complete the wave 1 of the major wave C.

Looking at the long-term chart (1900 to August 2011) below, I expect the end of this major wave C to reach at least the major wave A level of March 2009's low of 6,547 level. This major wave C can either be the C of the super wave (IV) as shown below. (A-B-C-D-E formation).

OR it can be the major wave C of the mega wave VI as shown below (a-b-c formation). In this case the major wave C can even reach the 5000 level depending whether the mega wave VI is a contracting a-b-c or a zig-zag a-b-c.

Besides the above two possible wave counts, there is actually another possible wave count that is more bullish as shown below.

I considered this scenario as highly unlikely. Under this scenario, the peak of the 'Dot-com bubble' in October 1999 is the end of mega wave V (not the October 2007 peak). From October 1999 to the March 2009's low, Dow took 10 years to form an expanding a-b-c to complete the mega wave VI as shown below.

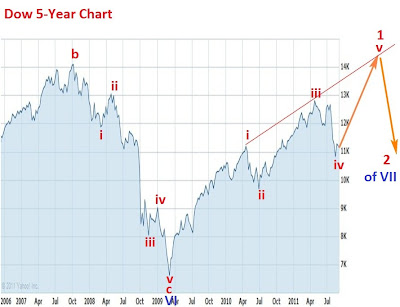
In this unlikely case, the March 2009 low of 6,547 actually marked the starting of a new bull market, the mega wave VII.
So far Dow has completed sub-wave i, ii, iii and iv of its wave 1. Under this scenario, Dow will have to run all the way to 14,000 from the current level to complete its sub-wave v and the wave 1. That is a 2,700 points gain.

This possibility can be ruled out within the next 5 trading days (hopefully) the moment Dow failed to reach the 11613 level (set on 31st August) and starts to move lower to set another low that is lower than its previous low.
.
No comments:
Post a Comment